
Performance analytics has quietly become one of the most powerful levers in modern business, turning raw numbers into practical decisions, sharper strategy, and real growth. It bridges the gap between “we think” and “we know”, letting teams act with confidence instead of guesswork.
What Is Performance Analytics?
Performance analytics is the practice of measuring, tracking, and interpreting data to understand how well your business, teams, and systems are performing over time. It swaps opinions for evidence and gut feel for measurable results.
At its core, performance analytics:
-
Connects actions to outcomes so you can see what is working and what is not.
-
Compares current performance against goals, benchmarks, or past results.
-
Highlights patterns, trends, and gaps so teams can improve instead of react blindly.
You can apply it in almost any area—operations, finance, marketing, HR, IT, customer service, or digital platforms. Wherever performance matters, analytics can give you a clearer view of reality and a smarter way forward.
Why Performance Analytics Matters More Than Ever
Business today moves fast: customer expectations shift, competitors experiment, and costs can change overnight. In that kind of environment, relying purely on intuition is like sailing in a storm without instruments.
Performance analytics matters because it:
-
Reduces risk by replacing assumptions with actual evidence.
-
Speeds up decisions by putting the right numbers in front of the right people at the right time.
-
Sharpens focus by cutting through vanity metrics and surfacing the numbers that truly link to your goals.
It also supports accountability. When performance is visible through clear metrics and dashboards, teams know what’s expected, leaders can track progress without micromanaging, and discussions shift from blame to problem‑solving.
Key Objectives of Performance Analytics
Performance analytics is not just about “having data”; it is about what you do with it. Common objectives include:
-
Visibility
You want a clear, up‑to‑date picture of how your business is performing—what’s on track, what’s lagging, and what’s at risk. -
Alignment
Analytics helps ensure that daily activities actually support the bigger strategy. When people see how their work ties to key metrics, alignment happens more naturally. -
Continuous improvement
Data becomes your feedback loop. It tells you what to keep, what to fix, and what to stop. That’s how small tweaks turn into ongoing performance gains. -
Risk reduction
Early signals in the data warn you about issues before they turn into crises—whether that’s churn, quality problems, or financial pressure.
How Performance Analytics Work (Step by Step)
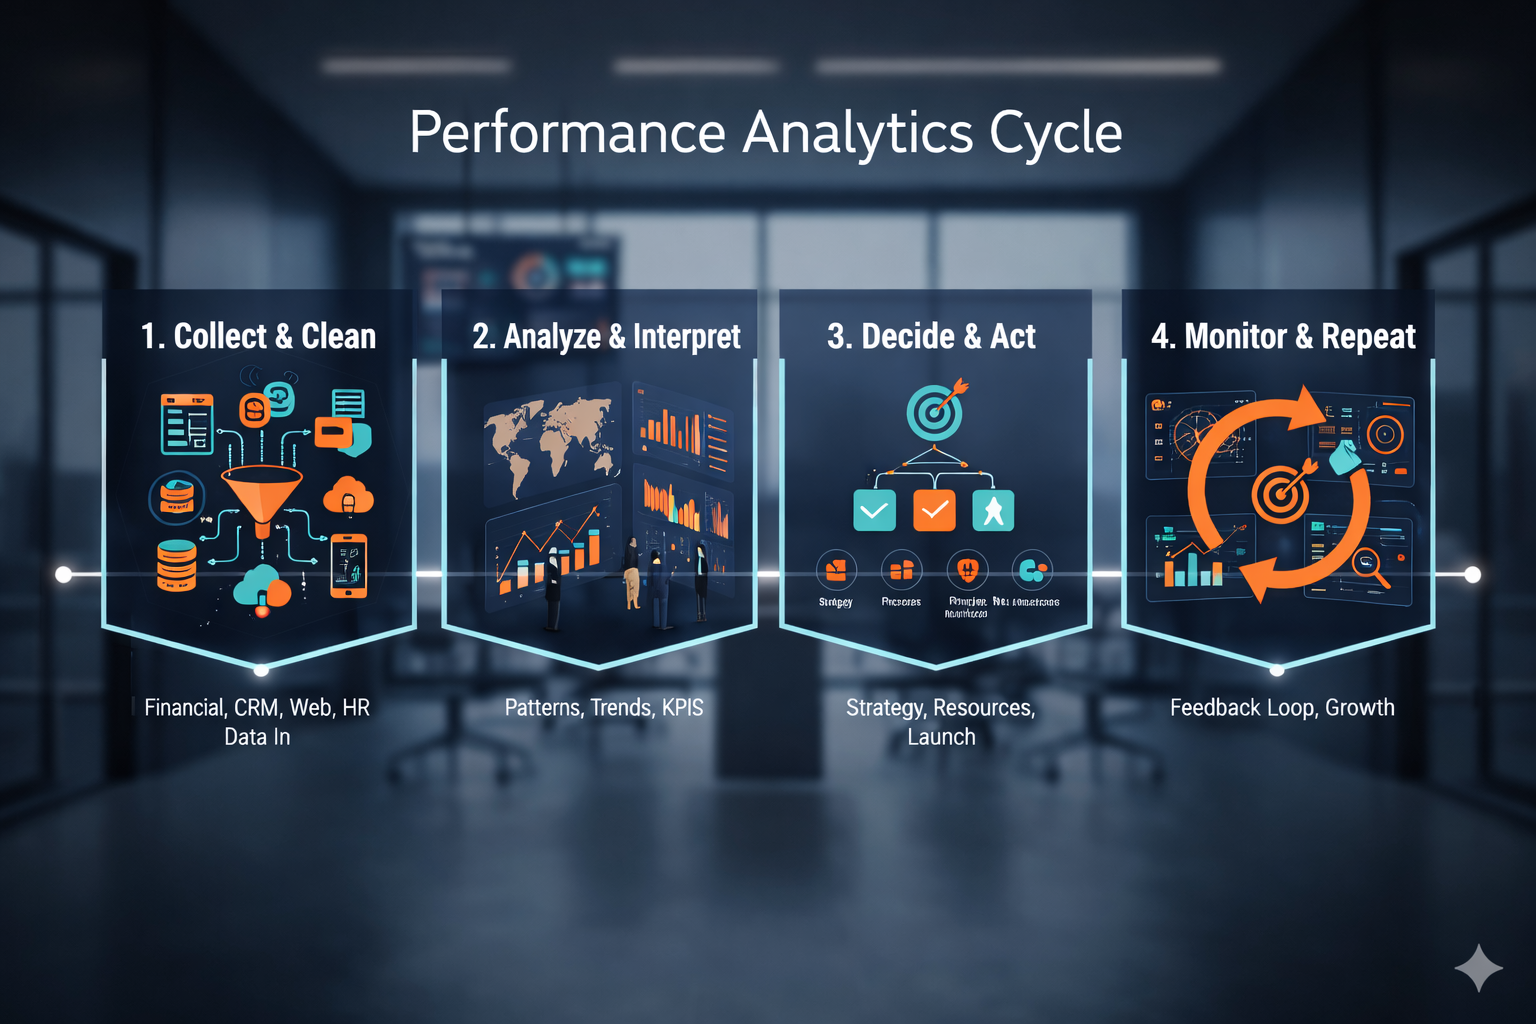
Think of performance analytics as a cycle rather than a one‑time project. In simple terms, the process looks like this:
Collect the right data
Data flows in from financial system, CRM, HR platform, website analytics, support ticket, and operational tools.
Clean and combine it
Raw data is standardized, cleaned, and integrated so different systems “speak the same language.” This step reduces errors and noise.
Analyze using methods and visuals
Teams use reports, dashboards, and analytical techniques to uncover patterns, trends, correlations, and outliers. Charts and visualizations make complex data easier to digest.
Interpret the findings
Analysts and leaders look at the results through a business lens:
- What story is this data telling us?
- Which KPIs are improving or slipping?
- What might be causing the change?
Decide and act
Data informs decisions: adjust budgets, refine processes, change targets, reallocate resources, or launch new initiatives.
Monitor and repeat
Performance analytics is continuous. As you act, you keep tracking the numbers, learn from the impact, and refine again.
Done well, this cycle turns data into a strategic asset—something that guides decisions rather than just sitting in spreadsheets.
Types of Performance Analytics (From “What Happened?” to “What’s Next?”)
Different types of analytics answer different questions. When you combine them, you move from hindsight to foresight and then to action.
Descriptive Analytics – What Happened?
Descriptive analytics looks backward. It summarizes historical data into reports, charts, and dashboards.
You might use it to:
-
See last quarter’s revenue by region.
-
Track monthly website traffic or call volumes.
-
Compare this year’s performance with last year’s.
It doesn’t tell you why something happened, but it gives you a clear baseline picture.
Diagnostic Analytics – Why Did It Happen?
Diagnostic analytics goes deeper and asks, “Why did performance change?”
It digs into relationships in the data:
-
Why did sales drop in one region but grow in another?
-
Why did churn spike after a certain pricing change?
-
Why did delivery times increase during a specific period?
By exploring causes instead of just symptoms, you can fix root problems instead of applying cosmetic solutions.
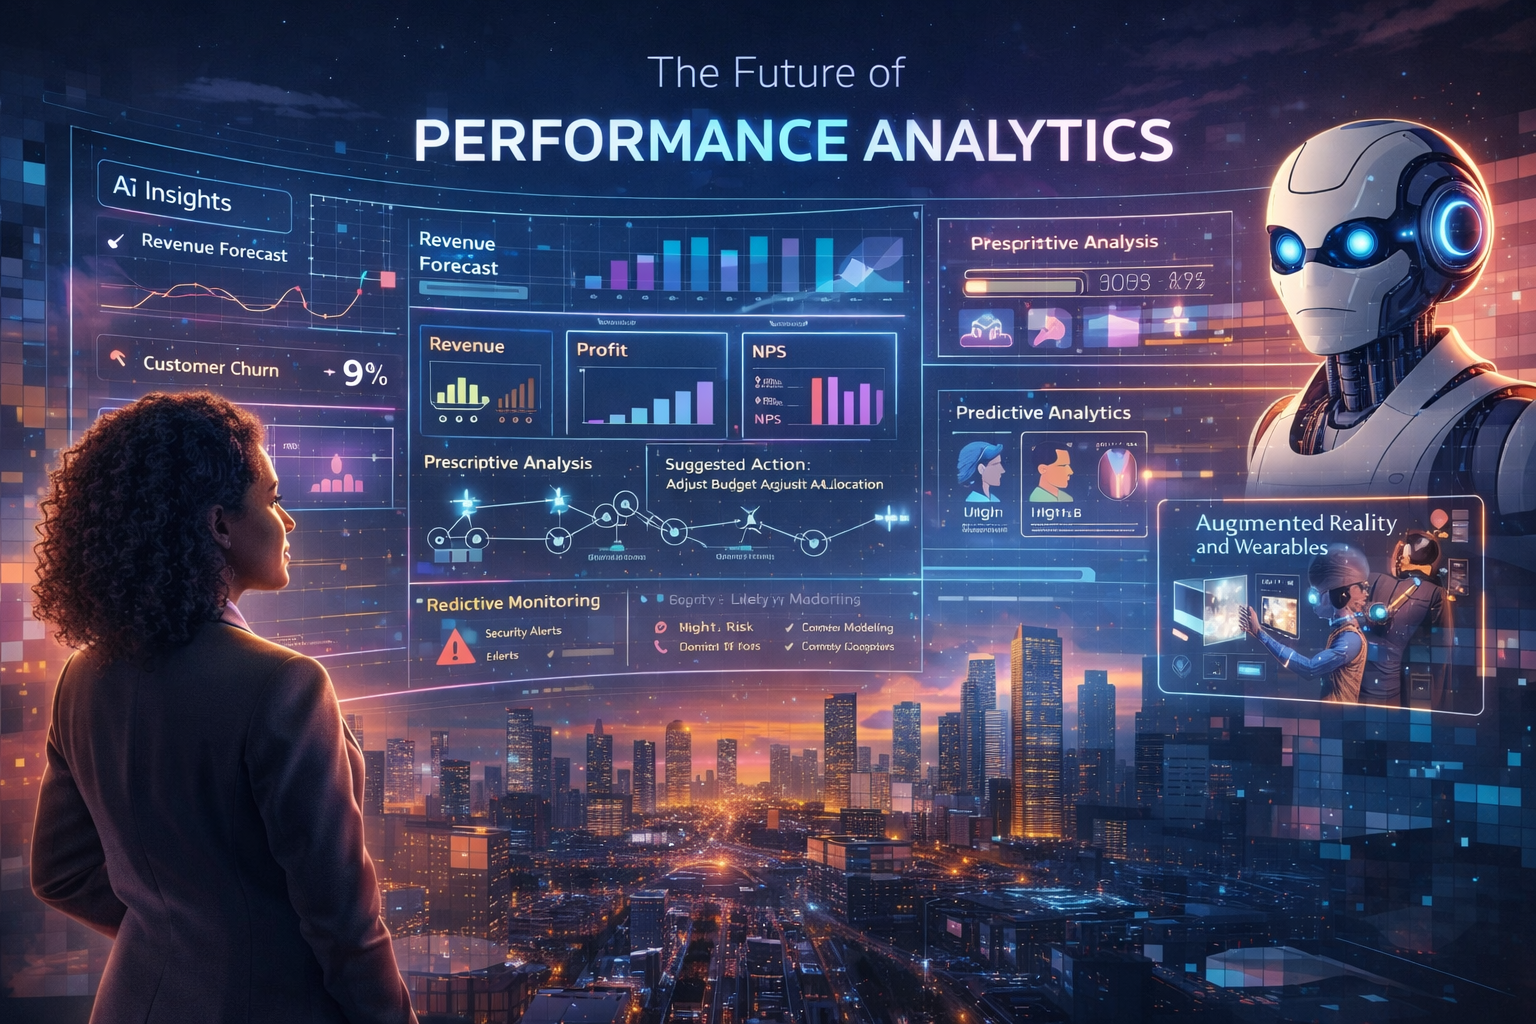
Predictive Analytics – What Is Likely to Happen?
Predictive analytics uses historical data, patterns, and statistical or machine learning models to forecast future outcomes.
Common uses include:
-
Forecasting demand, revenue, or cash flow.
-
Predicting which customers are at high risk of churn.
-
Estimating how changes in pricing or marketing might affect results.
It’s not magic—but when designed well, it gives you a “data‑powered weather forecast” for your business so you can prepare instead of react.
Prescriptive Analytics – What Should We Do?
Prescriptive analytics goes one step further and suggests actions. It asks, “Given what we know and what’s likely, what’s the best move?”
Examples:
-
Recommending the optimal discount range to maximize profit and volume.
-
Suggesting staffing levels by hour to meet service targets without overspending.
-
Prioritizing which accounts sales teams should focus on for the highest impact.
It doesn’t just predict; it helps choose.
Advanced Analytics – Deeper, Complex Insights
Advanced analytics uses more sophisticated models and techniques to handle large, complex, or messy data sets.
Organizations use it when they:
-
Operate at scale with millions of records.
-
Need nuanced segmentation, advanced forecasting, or optimization.
-
Want to detect subtle patterns that humans might miss.
This is where data science teams typically operate, translating complex outputs into clear business recommendations.
Real‑Time Analytics – What’s Happening Right Now?
Real‑time analytics focuses on the present moment. Instead of waiting for weekly or monthly reports, teams see what is happening as it happens.
It is crucial when:
-
You monitor website or app performance minute‑by‑minute.
-
You manage logistics, inventory, or supply chains where delays are costly.
-
You run campaigns and want to tweak them in real time based on live results.
In fast‑moving environments, real‑time visibility can be the difference between preventing a problem and simply reporting one after it’s too late.
Key Performance Indicators (KPIs) That Matter
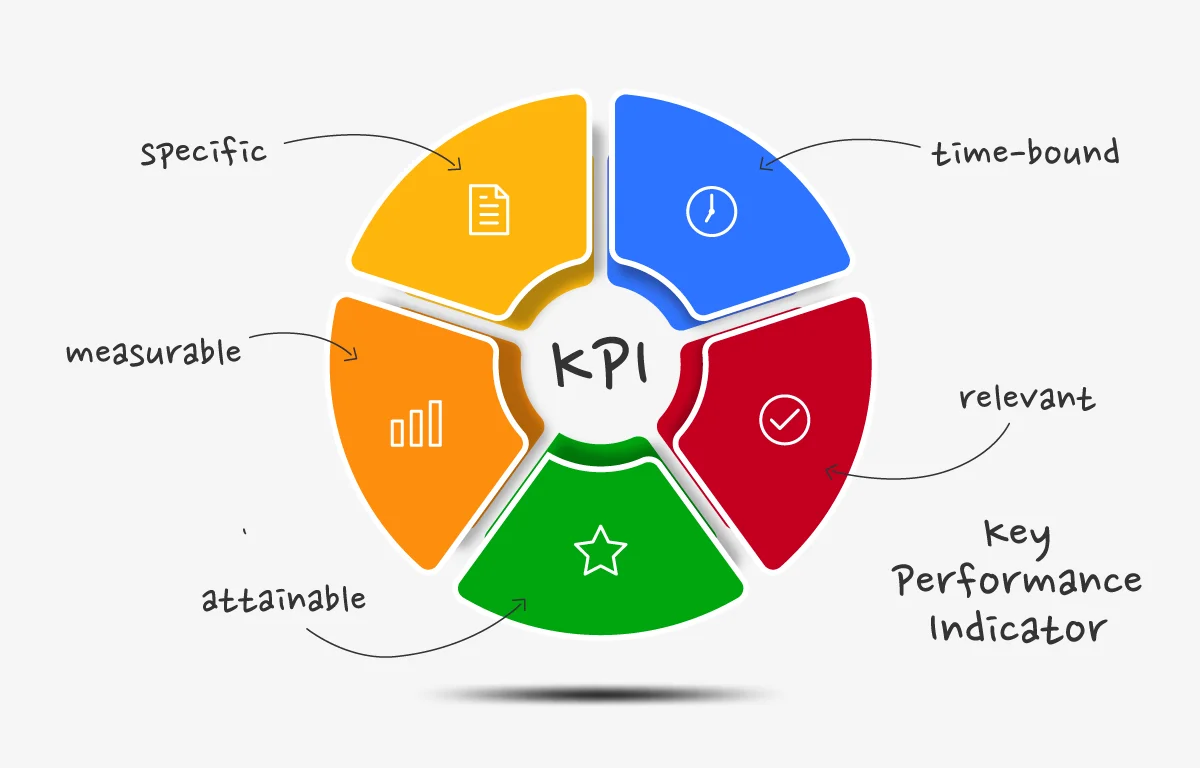
Key Performance Indicators (KPIs) are the backbone of performance analytics. They are the numbers that signal whether you’re winning, plateauing, or slipping.
Good KPIs are:
-
Aligned with business goals.
-
Measurable with reliable data.
-
Actionable so people can actually influence them.
Common KPI categories include:
-
Revenue
Total money earned within a period. It helps you see growth, seasonality, and the effect of strategies on top‑line performance. -
Profit
What’s left after costs. It’s the reality check that revenue alone can’t give. -
Customer satisfaction
Scores from surveys, NPS, reviews, and support feedback. High satisfaction usually leads to better loyalty and advocacy. -
Employee satisfaction
Engagement scores, pulse surveys, and retention data. Happy, engaged teams usually perform better and churn less. -
Productivity
Output versus input—how effectively your teams or systems turn resources into results, from completed tasks to units produced.
When employees understand which KPIs matter and how their work contributes, they tend to be more focused and committed. Recognition tied to clear metrics can also drive a high‑performance culture.
Benefits of Performance Analytics for Your Business
When you implement performance analytics properly, the payoff can touch every part of the organization.
Better Visibility Across Operations
With performance analytics, leaders don’t have to guess what’s happening in sales, operations, finance, or HR. Data makes the picture clear—what’s healthy, what’s fragile, and what needs urgent attention.
Stronger Data‑Driven Decisions
Instead of “I feel like this will work,” you move to “The data suggests this is the best option.” That doesn’t mean you ignore experience, but now it’s backed by real evidence.
This reduces costly missteps and gives teams more confidence in their choices.
Higher Operational Efficiency
Analytics reveals bottlenecks, delays, and waste: slow approval chains, underused systems, or repeated manual work.
Once you see these friction points, you can redesign processes, automate tasks, and reallocate resources to raise output without raising costs at the same rate.
Clearer Accountability and Fair Performance Tracking
Transparent metrics help everyone understand how performance is judged. Teams know what success looks like, which builds fairness and trust.
Instead of vague feedback, leaders can point to specific data: “Here’s where we improved, here’s where we fell short, and here’s what we’ll do next.”
Continuous Improvement Built In
Because performance analytics is ongoing, it naturally creates a feedback loop. Teams test ideas, watch the impact, and adjust.
That “test, measure, refine” cycle leads to continuous improvement instead of one‑off fixes.
Better Alignment With Business Goals
When KPIs are linked directly to strategic goals, every department can see exactly how their success contributes to the bigger picture.
Alignment reduces duplicated effort, scattered priorities, and mixed signals. Everyone rows in the same direction.
Faster Response to Change
Markets change, technology shifts, customers move on. With timely analytics, you see those shifts early and adapt.
Instead of discovering problems months later in a quarterly review, you spot them while they are still small and manageable.
Common Challenges in Performance Analytics
Of course, it’s not all plug‑and‑play. A few recurring challenges often show up:
-
Poor data quality
If your data is incomplete, inconsistent, or inaccurate, your insights will be misleading. “Garbage in, garbage out” still applies. -
Fragmented systems
Data spread across disconnected tools makes it hard to get a unified view. Integrations and standardization take effort. -
Skill gaps
Teams may not be comfortable reading dashboards, understanding basic statistics, or asking the right questions. Without training, the value of analytics shrinks. -
Cultural resistance
Shifting from intuition‑driven decisions to data‑driven ones can feel threatening. It takes leadership support and clear communication to change mindsets.
Recognizing these obstacles early helps you plan for better tooling, better processes, and better education.
Performance Analytics vs. Performance Appraisals
These two concepts are often confused, but they are not the same. Think of them as different lenses on performance.
| Aspect | Performance Analytics | Performance Appraisals |
|---|---|---|
| Focus | Business processes, systems, and overall outcomes | Individual employee performance |
| Purpose | Improve efficiency, results, and decision‑making | Evaluate contribution, set goals, and give feedback |
| Data Source | Operational, financial, customer, and system data | Manager reviews, peer feedback, performance records |
| Frequency | Continuous or near real‑time | Periodic (often annual or quarterly) |
| Approach | Data‑driven and objective | Often subjective and review‑based |
| Typical Outcome | Strategy and process improvements | Ratings, promotions, development plans |
Traditional Reviews vs. Modern Performance Analytics
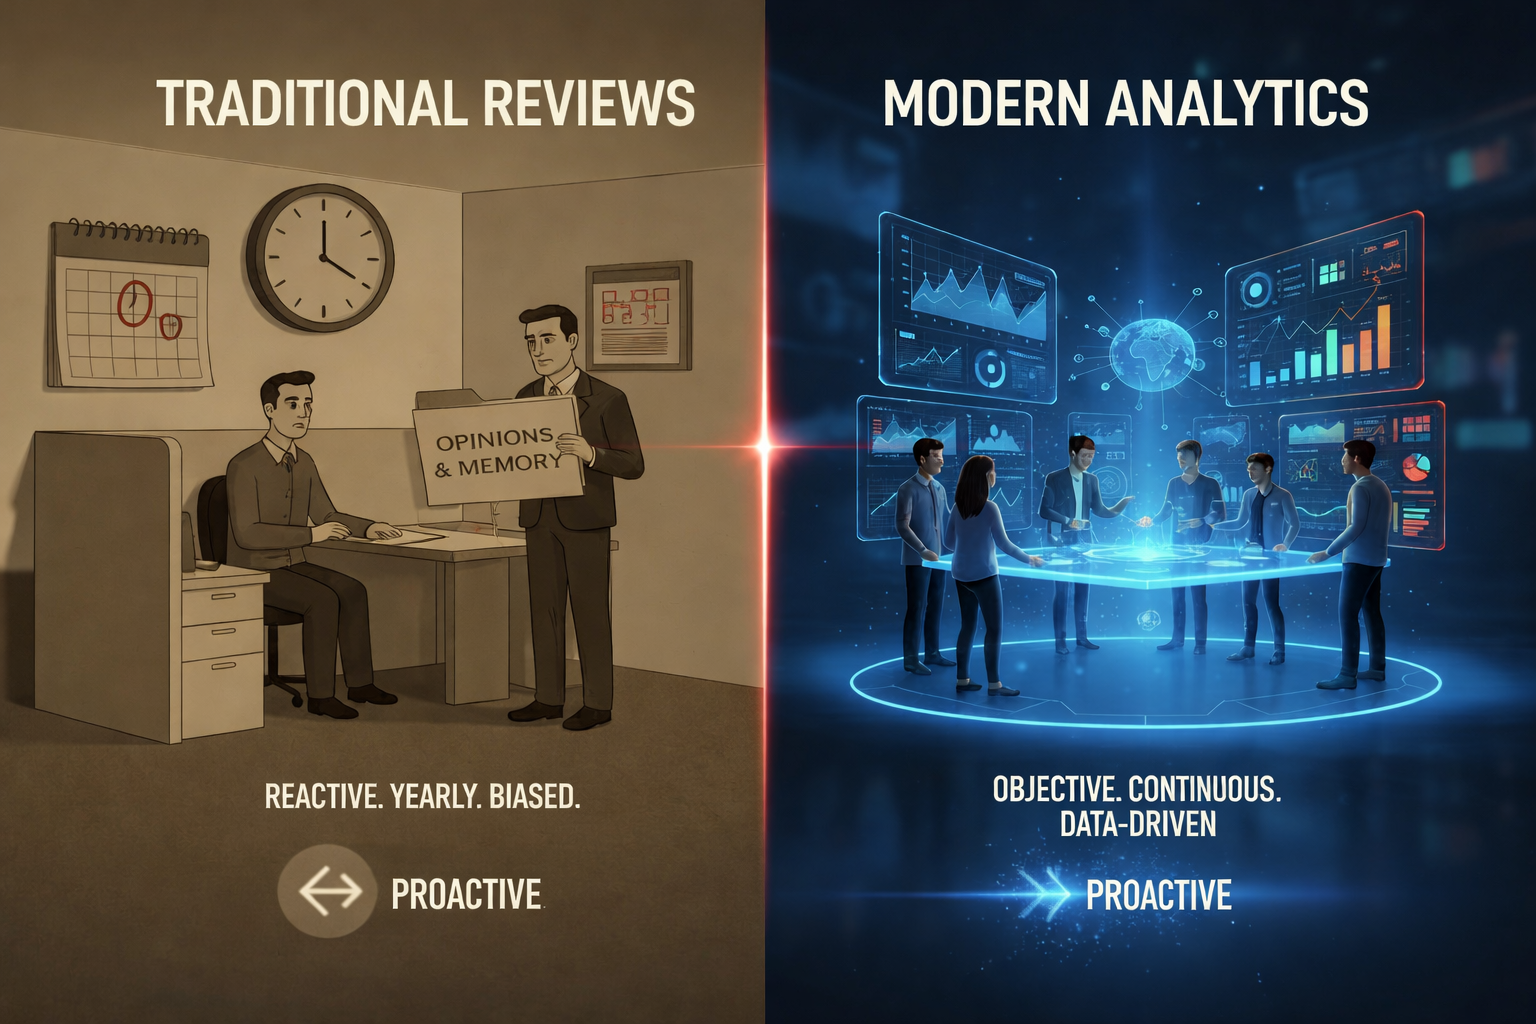
Classic performance reviews tend to look backward and rely heavily on opinion. Performance analytics offers something much more dynamic.
| Aspect | Traditional Performance Review | Performance Analytics |
|---|---|---|
| Evaluation Timing | Periodic (e.g., yearly) | Continuous monitoring |
| Basis of Assessment | Manager opinions and memory | Ongoing, data‑driven insights |
| Focus | Past performance | Ongoing trends and future impact |
| Accuracy | Prone to bias and recency effects | More objective and consistent |
| Decision Support | Limited | Strong and actionable |
| Improvement Style | Reactive (after the fact) | Proactive and continuous |
How to Execute Performance Analytics in Practice
If you want to move from theory to action, here’s a simple roadmap you can follow.
1. Set Clear Objectives
Start by asking:
-
What do we want to improve?
-
Where are we struggling: productivity, engagement, revenue, quality, or something else?
Narrow, specific goals make it easier to choose the right data and KPIs.
2. Pick the Right KPIs
Choose a small set of meaningful metrics that directly reflect your objectives. Avoid tracking everything—it just adds noise.
Ask of each KPI:
-
Does this metric truly matter to our goals?
-
Can we measure it consistently?
-
Can people realistically influence it?
3. Collect and Integrate Data
Pull data from relevant sources—systems, surveys, tools, and platforms. Then:
-
Clean it (remove duplicates, fix obvious errors).
-
Standardize formats (dates, currencies, IDs).
-
Integrate where possible so you can see the full picture.
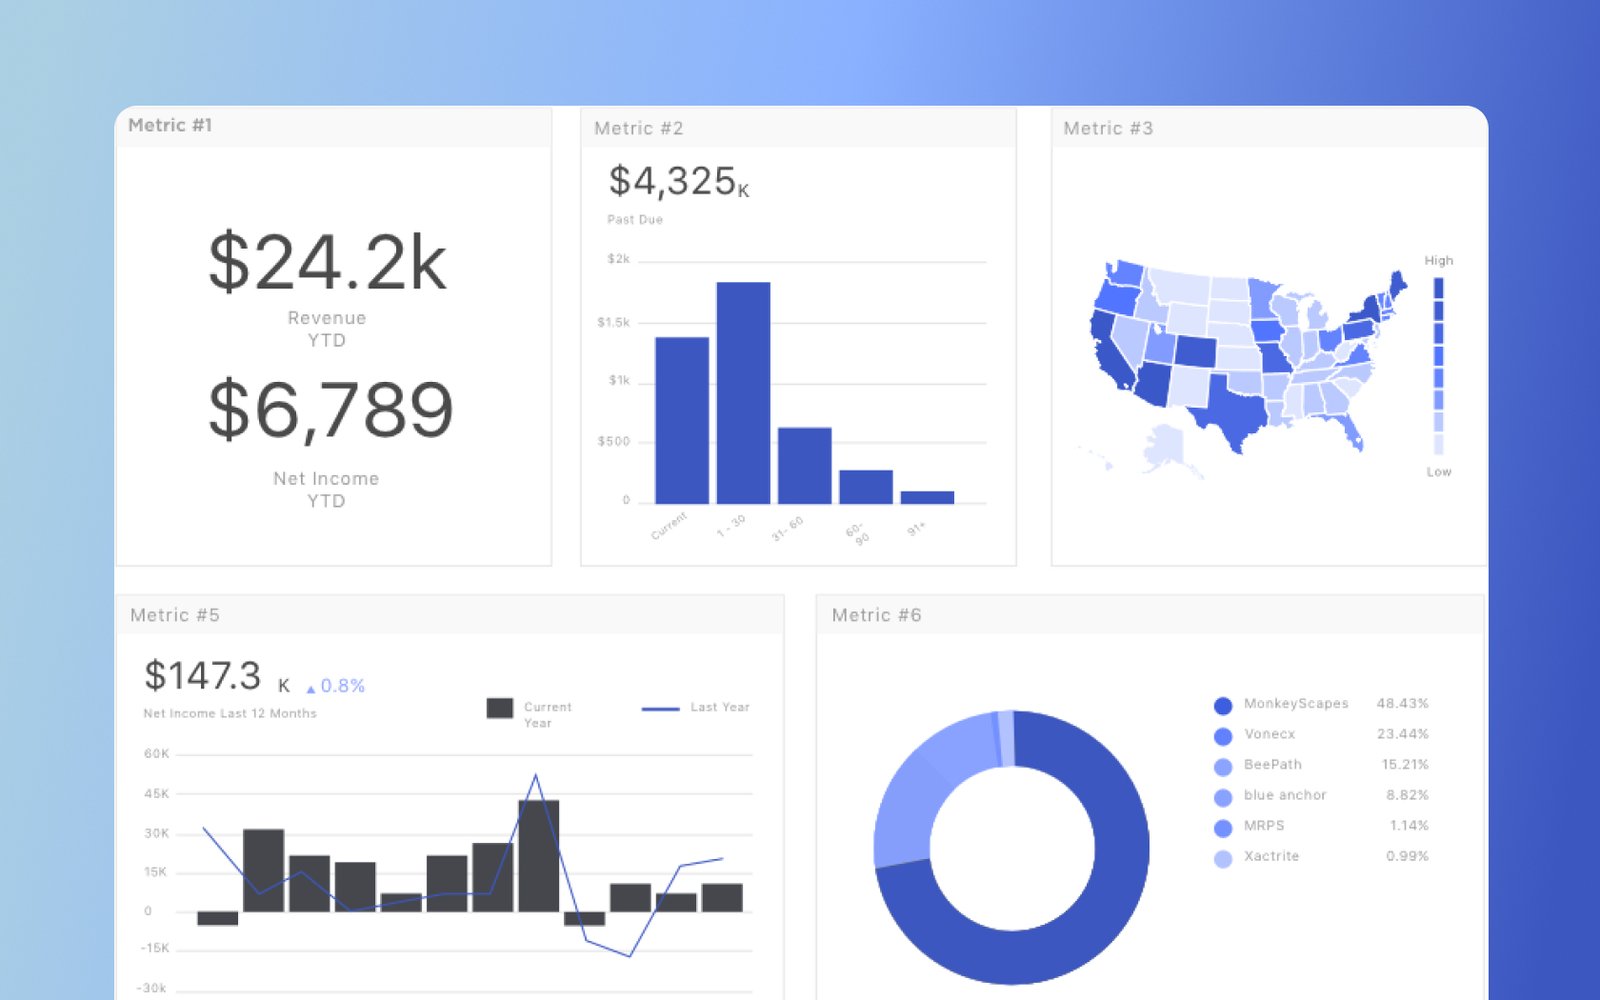
4. Build Dashboards and Reports
Design simple, intuitive dashboards that:
-
Show key metrics at a glance.
-
Highlight trends, not just raw numbers.
-
Use visuals (charts, heatmaps, gauges) to make interpretation easier.
Different audiences need different views—executives, managers, and frontline teams won’t all use the same layout.
5. Benchmark and Compare
Compare performance against:
-
Previous periods (month‑over‑month, year‑over‑year).
-
Targets or budgets.
-
Industry benchmarks where available.
This context turns “we hit 78%” into “we’re improving, but still behind the target of 90%.”
6. Conduct Root‑Cause Analysis
When something goes wrong (or exceptionally well), don’t stop at the surface. Dig in with techniques like:
-
The Five Whys (ask “why?” repeatedly until you reach the root cause).
-
Pareto analysis to see which causes contribute most to a problem.
The aim is to fix systemic issues, not just patch symptoms.
7. Study Performance Drivers
Data tells you what is happening, but you still need insight into why. Combine:
-
Quantitative data (numbers, charts).
-
Qualitative input (feedback from teams, customers, managers).
Together, they tell a richer story and prevent misinterpretation.
8. Look for Trends and Patterns
Don’t just react to one‑off spikes or dips. Look for:
-
Seasonality.
-
Repeating patterns after certain events or changes.
-
Correlations between different KPIs.
This pattern recognition is where real strategic insight emerges.
9. Turn Insight Into Action
Every analysis should end with a decision or experiment:
-
What will we start doing?
-
What will we stop doing?
-
What will we change and by when?
Assign owners, timelines, and success indicators so actions don’t fade into “nice ideas.”
10. Maintain a Continuous Feedback Loop
Encourage constant conversation around performance data. Make it normal to talk about metrics in team meetings, 1:1s, and planning sessions.
As you learn what works, update your dashboards, refine KPIs, and adjust strategies. This is how analytics becomes part of the culture, not just a quarterly ritual.
Tools Commonly Used in Performance Analytics
Different tools support different layers of performance analytics—from people and customers to finance and infrastructure. You’ll typically see categories such as:
-
Workforce and HR performance platforms
These focus on employee productivity, engagement, and goal tracking. They link individual objectives to organizational priorities and help teams see how their work supports bigger outcomes. -
CRM and sales analytics tools
These collect customer and deal data, track pipelines, and surface trends in revenue, win rates, and customer behavior. Sales leaders use them to forecast more accurately and refine go‑to‑market strategies. -
Infrastructure and IT monitoring solutions
These track system performance, storage, uptime, and response times. By spotting bottlenecks and anomalies early, they prevent outages and keep digital services reliable. -
Financial performance platforms
These help monitor revenue, margins, expenses, cash flow, and budget adherence. Finance teams and leaders use them to keep the business stable, compliant, and growth‑ready.
What matters most is not the brand name of the tool, but whether it:
-
Integrates with your existing systems.
-
Provides clear, configurable dashboards.
-
Scales with your data and team size.
-
Is understandable for non‑technical users.
Use Cases: Performance Analytics in Action
To see the value in real life, it helps to imagine how different teams might use performance analytics.
-
Sales
Track revenue growth, conversion rates, and pipeline health. Identify which segments, products, or campaigns drive the strongest results—and double down on them. -
Supply chain & operations
Monitor inventory levels, lead times, on‑time delivery, and supplier reliability. Use insights to reduce stockouts, shrink delays, and cut unnecessary costs. -
Websites & digital products
Measure page load times, bounce rates, session lengths, and user flows. Use this to optimize UX, prioritize features, and improve conversion. -
Customer service
Track response times, resolution rates, satisfaction scores, and ticket volumes. Identify recurring issues and fix them upstream. -
HR & people operations
Analyze hiring funnels, time‑to‑fill roles, retention, internal mobility, and engagement. Use these insights to strengthen culture and talent strategy.
Across all of these, the pattern is the same: data highlights where to focus, and teams use that clarity to improve outcomes.
Conclusion
Performance analytics turns data from a by‑product of work into a driver of better work. It gives you clear visibility into what is happening, helps you understand why, and supports smarter decisions about what to do next.
When you use it consistently, teams align around meaningful KPIs, leaders act with confidence instead of guesswork, and improvement becomes a built‑in habit rather than a one‑off initiative. Over time, that discipline compounds into stronger performance, more resilient operations, and more sustainable growth.